
Most makers can quote their best-seller's retail price within a dollar. Ask them its gross margin and the room goes quiet.
That gap matters more than almost anything else you'll learn this year. Knowing what you charge is not the same as knowing what you keep — and the difference is where most maker businesses quietly leak money. The fix isn't another quarterly retreat with a CPA, and it isn't a new spreadsheet either. It's fifteen numbers, none of which take more than ten minutes to find, most of which you should be able to state from memory.
The good news: once you know them, they stop running your business behind your back. You start running it in front.
The ground rules
A few notes before the list itself.
- "From memory" doesn't mean to the penny. It means a confident range. Knowing your gross margin is "around 58%" beats knowing it's "somewhere between 30 and 70."
- Find each one once, then update on a cadence. Some are monthly (cash, sales). Some are quarterly (taxes, customer metrics). A few are annual (inventory turns, effective hourly wage).
- If a number is hard to find, that's the lesson. It usually means the data isn't being captured — and the fix is upstream of the spreadsheet.
Each section below has the number, why it matters, and how to get it in ten minutes if you don't have it.
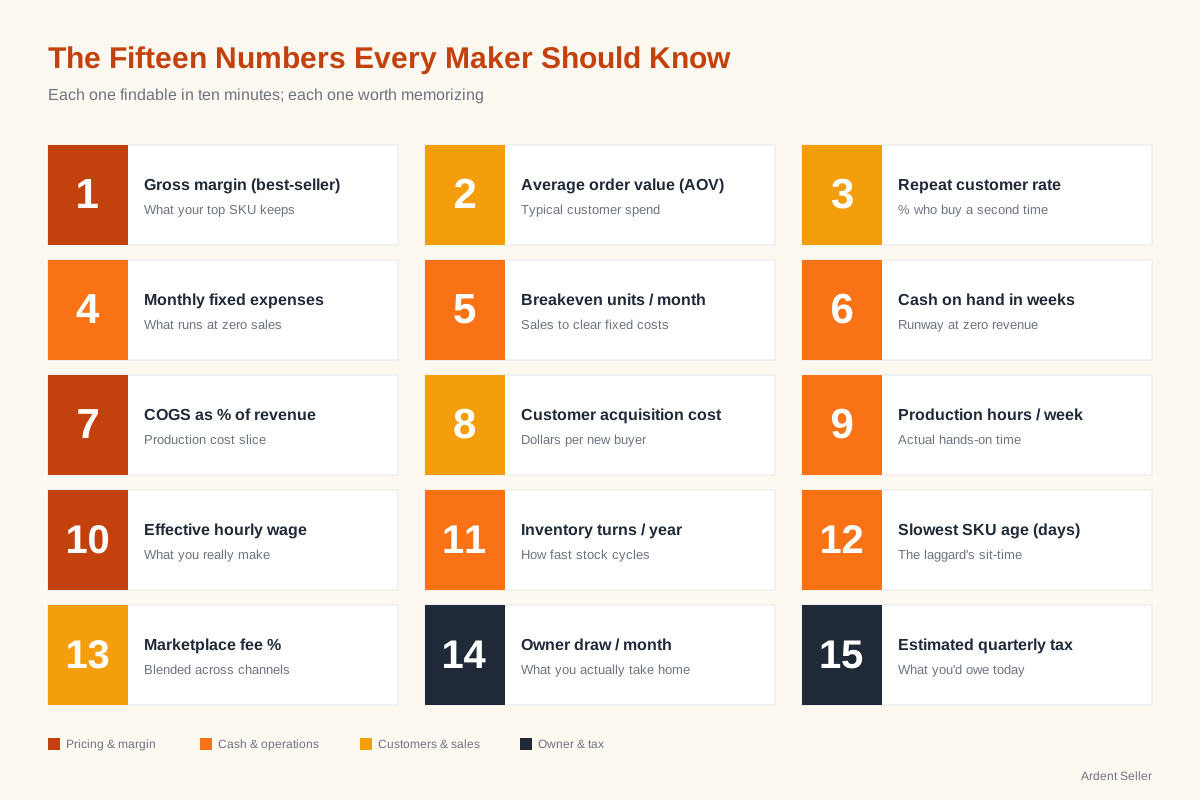
The numbers
1. Gross margin on your best-selling product
The number: Gross margin = (price − direct costs) ÷ price, expressed as a percentage.
This is the first number every maker should know. Not the markup, not the price, not the wholesale rate — the margin. If your best-seller retails for $24 and costs $9 in direct materials, packaging, and labor, your gross margin is 62.5%. That number tells you how much room you have to absorb fees, discounts, and surprises before the product becomes a charity case.
How to get it in ten minutes: Open your latest costing sheet for your top SKU. Add up materials, packaging, hands-on labor (at a real hourly rate), and direct production costs. Subtract that total from the price. Divide by the price. Done.
If you don't have a costing sheet for your top SKU, that's the bigger problem. Start there — see our recipe costing primer for the full method.
2. Average order value (AOV)
The number: Total revenue divided by total number of orders, for any given period.
AOV tells you what the typical customer actually spends — not what your best customer spends, not what you wish customers would spend. It anchors decisions about free-shipping thresholds, bundle pricing, and whether to push add-ons at checkout.
A maker with a $18 AOV runs a different business than one with a $85 AOV, even if their annual revenue is identical. The first lives or dies on volume and shipping math. The second can afford to slow down and curate.
How to get it in ten minutes: Last month's Etsy, Shopify, or Square dashboard usually shows it directly. If not, divide total revenue by order count.
3. Repeat customer rate
The number: Percentage of customers who place a second order within twelve months.
Most makers obsess about acquiring new customers and ignore the ones already in their database. Repeat rate is the receipt for whether your product, packaging, and follow-up actually create a relationship — or just a transaction.
A repeat rate below 15% usually means you're selling a one-time gift, even if you didn't mean to. Above 35% means you've built something people return to.
How to get it in ten minutes: In your sales platform, filter customers by "purchased more than once" and divide by total customers from twelve months ago.
4. Monthly fixed expenses
The number: Every recurring cost you'd still pay if you sold zero units this month.
Studio rent, insurance, software subscriptions, the storage unit you forgot about, the Adobe license, the Zoom plan, the second domain name you bought during a planning weekend two years ago. Add them all up. Most makers under-estimate this number by 20-40% because the small ones disappear from memory.
How to get it in ten minutes: Pull last month's bank and credit card statements. Highlight every charge that isn't direct material cost or shipping. Total them.
Sidebar. If you pay yourself a regular draw, that goes in fixed expenses too. So does an estimated quarterly tax accrual (see #15). Treat both as costs, not as profit.
5. Breakeven units per month
The number: Monthly fixed expenses ÷ gross margin per unit. The number of best-sellers (or equivalents) you must sell each month just to keep the lights on.
This is the number that turns "I'm so busy" into either "I'm so profitable" or "I'm running in place." If your fixed expenses are $2,400/month and your average gross margin per unit is $12, you need to sell 200 units a month before you start earning anything for yourself.
When sellers describe their business as "going well" without knowing this number, what they usually mean is "going busy."
How to get it in ten minutes: Use #4 (fixed expenses in dollars) and #1 (gross margin per unit in dollars, not percentage).
6. Cash on hand in weeks of expenses
The number: Cash in your business account ÷ weekly average expenses.
Profit on paper is not the same thing as money in the bank. A business with healthy margins can still fail because the cash arrives six weeks after the expenses. This number tells you how long you can keep operating if revenue went to zero tomorrow.
Anything under four weeks is white-knuckle territory. Eight to twelve weeks is comfortable. For seasonal sellers who lose entire quarters to slow months, six months is the goal — and the topic of our seasonal cash flow guide.
How to get it in ten minutes: Check your business account balance. Divide by average weekly expenses (monthly expenses ÷ 4.3).
7. COGS as a percentage of revenue
The number: Cost of goods sold ÷ revenue for a given period.
COGS isn't just material cost — it's everything that scales with production: raw materials, packaging, direct labor, and the variable supplies that get consumed making each unit. As a percentage of revenue, it tells you whether your pricing model is actually working.
For most maker businesses, COGS in the 30-50% range is healthy. Above 60% and you're working hard for very little. Below 25% and you're either a digital product seller, an exceptionally efficient operator, or someone who has forgotten to include some real costs.
How to get it in ten minutes: Sum your COGS line items from the past month. Divide by the same month's revenue. If you've never separated COGS from total expenses, our COGS primer walks through the four buckets.
8. Customer acquisition cost (CAC)
The number: Total marketing/advertising spend ÷ number of new customers acquired in the same period.
CAC is the price tag on each new customer's head. If you spent $300 on Etsy Offsite Ads, market booth fees, and Instagram ads last month, and you got 60 new customers, your CAC is $5.
CAC only earns its keep when you compare it against #2 (AOV) and #3 (repeat rate). A $5 CAC on a $18 AOV looks great until you realize 80% never come back — at which point you're spending $5 to earn $18 once, instead of $5 to earn $18 plus $18 plus $18.
How to get it in ten minutes: Add every dollar spent winning customers last month — ads, sponsored posts, market booth fees, sample sends. Divide by new customer count.
Sidebar. Word-of-mouth and organic search count as "free" acquisitions for this number, but they're not actually free if you spent ten hours writing the blog post that earned the search traffic. Decide whether to count your own time, and stick to one rule.
9. Production hours per week
The number: Actual time hands-on making, separated from time admin-ing, photo-ing, replying, packing, and posting.
Most makers think they spend 30 hours a week making. They spend 8. The rest is everything else — and "everything else" is where the bottleneck actually lives. You don't need a time-tracking app for life. You need one week of honest observation.
This number changes everything about pricing math. If you genuinely produce 8 hours a week, your effective hourly rate has to absorb the other 22 hours of running-the-business time. Most pricing formulas pretend that ratio is 1:1. It almost never is.
How to get it in ten minutes: You can't. This one takes a week of timer use. Worth it.
10. Effective hourly wage
The number: (Revenue − COGS − channel fees) ÷ total hours worked on the business, including admin.
This is the truth-teller. Everyone has an aspirational hourly rate ("I charge myself $45 an hour in my costing"). The effective hourly wage is what you actually take home divided by every hour you actually worked — making, admin, photographing, packaging, customer service, the lot.
If the aspirational rate is $45 and the effective rate is $11, you're not running a $45-an-hour business. You're running an $11-an-hour business with a $45 fantasy in its costing sheet.
How to get it in ten minutes: Use last quarter's numbers. Total revenue, minus direct material costs and marketplace fees, divided by your honest hour count (see #9). For a deeper walk-through, the true hourly wage post goes layer by layer.
Pro tip. If this number is dramatically lower than your aspirational rate, the culprit is usually one of three things — under-counting admin hours, over-discounting, or wholesale accounts at terms you can't actually afford.
11. Inventory turns per year
The number: Annual COGS ÷ average inventory value at cost.
Inventory turns tell you whether stock cycles or sits. A turn of 4 means your average inventory dollar sells through and gets replaced four times a year — roughly every three months. A turn of 1 means a year on the shelf for the average dollar.
Faster isn't always better (a craft show vendor with a turn of 12 might be stocking out constantly), but slow turns almost always mean tied-up cash. For most maker businesses, 3-6 turns annually is the comfortable range.
How to get it in ten minutes: Total cost of goods sold over the past year ÷ average inventory value at cost (start-of-year + end-of-year, divided by two).
12. Slowest-moving SKU's age in days
The number: Days since the slowest-moving item in your catalog last sold a unit.
Every catalog has one. The candle scent everyone said they loved at the launch and no one has reordered since. The pottery glaze you spent three weeks perfecting. The fabric pattern that photographed beautifully and won't move.
This number is a sanity check on the lag between making and admitting. The longer a SKU sits, the more it costs in storage, capital tied up, and shelf space that a faster-moving product could occupy.
How to get it in ten minutes: Sort your inventory list by "last sold date" ascending. The top row is your answer.
13. Marketplace fee percentage across all channels
The number: Total marketplace and processing fees ÷ marketplace revenue, weighted across every channel you sell on.
If you sell on Etsy, Faire, Square in person, and your own Shopify, you have four different fee structures and one blended reality. Knowing the blended number is what lets you compare channels honestly — and notice when one channel quietly becomes the most expensive way to make a sale.
For most maker businesses with multi-channel sales, the blended fee lands somewhere between 8% and 18% depending on the channel mix. Above 20% and you're either running heavy ads (Etsy Offsite Ads can push the number well above the base rate) or under-pricing for the channel.
How to get it in ten minutes: Last quarter, total marketplace fees ÷ total marketplace revenue. Don't forget Offsite Ads, payment processing, and currency conversion. The Etsy fees FAQ breaks down every component on Etsy specifically.
14. Owner draw per month
The number: What you actually pay yourself, in dollars, on a typical month.
This is the number most makers can't say out loud. Not because they don't know it — because they do.
The number isn't a moral judgment. A maker who pays themselves $400/month and is reinvesting heavily into inventory and equipment is doing something different than a maker who pays themselves $400/month because the business isn't generating more than that. But you can only tell which one you are if you can state the number.
How to get it in ten minutes: Look at the last three months of transfers from your business account to your personal account. Average them.
15. Estimated quarterly tax bill
The number: What you'd owe the IRS (and your state, if applicable) if you closed the books today.
For sole proprietors and single-member LLCs, this is roughly: (year-to-date revenue − year-to-date deductible expenses) × your effective tax rate (typically 25-35% for self-employed sellers when you include self-employment tax). Multiply by the fraction of the year completed.
Surprised? You're not alone. The IRS expects quarterly estimated payments, and getting blindsided in April is one of the most common — and most preventable — disasters in maker businesses.
How to get it in ten minutes: Your accounting software (or spreadsheet) should give you year-to-date profit. Multiply by 0.30 as a rough estimate. Subtract any quarterly payments already made. The hobby vs. business taxes post covers the deductions side of this equation in detail.
This is a rough estimate, not tax advice. Get an accountant or use a current-year tax calculator before writing a check. The actual rate depends on filing status, state, deductions, and a long list of things only your specific situation determines.
The five-number floor
If fifteen is too many to start with, here are the five that almost every maker can find this week, that almost every maker is missing, and that almost every business decision touches:
- Gross margin on your best-seller (#1) — without this, every pricing decision is a guess.
- Monthly fixed expenses (#4) — without this, you don't know what you have to clear.
- Cash on hand in weeks (#6) — without this, a slow month feels like a crisis when it shouldn't (or doesn't, when it should).
- Effective hourly wage (#10) — without this, you can't tell if you're running a business or a hobby that pays.
- Estimated quarterly tax (#15) — without this, April will surprise you.
If you do nothing else this week, do those five. Then add the others one per week until you've worked through all fifteen by mid-summer.
Where the numbers live
Most makers find these numbers scattered across four or five different places — Etsy's dashboard for AOV, a spreadsheet for COGS, a notebook for production hours, the bank app for cash, and gut feel for the rest. That's exactly why so many of them stay un-known.
A dedicated inventory and sales platform pulls most of these into one view. Ardent Seller's dashboard surfaces gross margin, inventory turns, slow-moving SKUs, and cash flow indicators alongside the underlying transaction data — which means the numbers you need to know are the numbers you actually see, every time you log in. Setting up the costing sheets and dashboard widgets takes an afternoon. After that, the fifteen numbers become passive. You'll know them because you've seen them.
The challenge
Open a notes app right now. Write down what you think each of the fifteen numbers is for your business — your honest best guess, not what you wish it were. Then spend the next week looking them up one at a time.
The numbers you wildly mis-estimated are exactly the levers worth pulling first. If you guessed your gross margin was 55% and the real number is 31%, your next move is obvious. If you guessed your repeat rate was 10% and the real number is 38%, your marketing budget is in the wrong place.
The point of knowing these numbers isn't to obsess over them. It's so they stop running your business behind your back.
Start a free 14-day trial of Ardent Seller and most of these numbers will be populated by the end of your first afternoon. Once your inventory and a few weeks of sales are in, the dashboard does the math you've been avoiding.
Related reading
- Recipe Costing 101: How to Build a Cost Sheet That Holds Up — The foundational primer for #1 and #7. If your costing sheets don't yet break out materials, packaging, labor, and overhead, start here before chasing margins.
- The True Hourly Wage of a Handmade Business — Goes layer by layer into #10. Includes worked examples for three composite makers and a self-employment tax adjustment most pricing formulas miss.
- Why Are My Margins Shrinking? — A diagnostic for what to do when #1 is moving in the wrong direction. Six symptom patterns and a four-step monthly margin check.
Free resources
Free companion downloads if you want to put any of this into practice:
- Maker Hourly-Rate Pricing Calculator — Turns #10 (effective hourly wage) into a live tool. Plug in revenue, COGS, channel fees, and an honest hour count and see your real take-home per hour.
- Quarterly Estimated Tax Worksheet — Turns #15 into a fillable worksheet that walks you through the year-to-date math the IRS expects every quarter.
- End-of-Month Closeout Checklist — Gives you the monthly habit that quietly updates #4, #6, #7, #13, and #14 — and stops the numbers from going stale.
This article is provided for educational purposes only and does not constitute financial, tax, or business advice. Cost structures, pricing examples, margin figures, and tax estimates are illustrative and will vary by your specific circumstances. Consult a qualified accountant or small-business advisor before making financial decisions based on this content.